Before a business automates a process, someone has to know what the process is. In many small and mid-size companies the real process lives in people's heads, email threads and spreadsheets, and it often differs from what anyone would write down from memory. A process map puts it on one page, so the people who run the work and the people who will automate it look at the same thing.
What business process mapping is#
Business process mapping is drawing how a piece of work actually moves through a company: each step, who does it, which tool they use, where the work passes from one person to another, and what happens when something goes wrong. The result is a process map, usually a diagram read from top to bottom or from left to right.
The first map shows how the work runs today, workarounds included. It is called the As-Is map. How the work should run goes on a second map, the To-Be map, drawn after the first one has been checked.


Why map a process before automating it#
Automating a process nobody has mapped tends to automate its problems. Steps that exist only because two tools could not pass data to each other get rebuilt in software. Exceptions that one person handles from memory get left out, and the new system breaks the first time one of them comes up.
A map shows what automation needs to know:
- where the same data is typed more than once;
- where work waits for one person, often the owner, because only they know a rule;
- where exceptions happen, and how often.
Mapping is part of a discovery phase: the map comes before anyone proposes what to build.
What goes on a process map#
| Element | What to write down |
|---|---|
| Steps | Each action, as a verb and an object: "enter the order", "check the price" |
| Who | The role that does each step, not the person's name |
| Tools | Where the step happens: email, a spreadsheet, the accounting software, paper |
| Hand-offs | Where the work passes to someone else, and how they find out |
| Decisions | Each point where the path splits, and the rule that decides it |
| Exceptions | What goes wrong, how often, and who fixes it |
| Time | How long each step takes, and how long the work waits before it |
| Volume | How often the whole process runs: a few times a month, or many times a day |
The waits matter as much as the steps. A step that takes ten minutes but waits two days for the owner's answer is where the delay is. Volume sets what a fix is worth: the same wait costs far more in a process that runs forty times a week than in one that runs twice a month.
Process mapping symbols#
A first map needs only a few shapes from an ordinary flowchart:
| Shape | Meaning |
|---|---|
| Oval | Start or end of the process |
| Rectangle | A step, done by a person or by software |
| Diamond | A decision: the path splits by a rule |
| Arrow | The order of the steps |
| Swimlane (a band across the map) | Who does the steps inside it |
| Document (a rectangle with a wavy bottom edge) | A form, a PDF or an email that moves with the work |
This is a simple flowchart set, not full BPMN. BPMN, the standard notation for business process diagrams, adds many more symbols, such as event types, gateway types and message flows,1 and a first map rarely needs them.
Two other formats are common. A SIPOC sums up a process in one table: suppliers, inputs, process, outputs and customers. A value stream map, from lean manufacturing, adds the working time of each step and the waiting time between steps.
The maps below write the role inside each step instead of drawing swimlanes, so they still read on a phone.
A business process mapping example: a customer order#
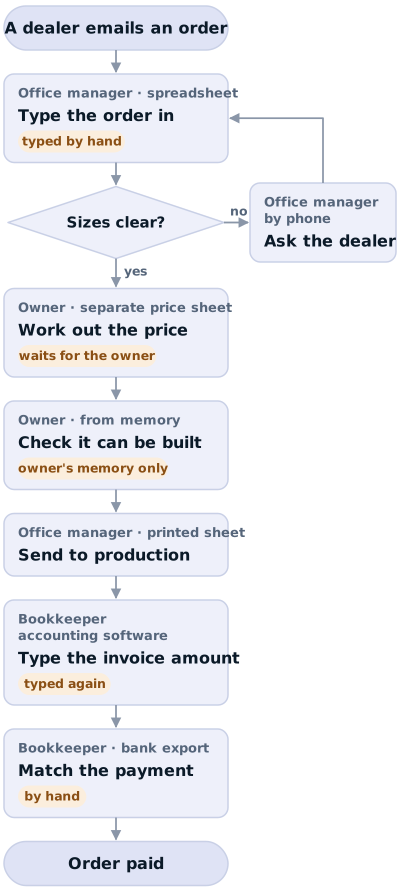
This is an illustration, not a client's process. A small manufacturer of made-to-measure products takes about 40 orders a week from dealers. Walked through with the people who do the work, an order runs like this:
| # | Step | Who | Tool | What goes wrong |
|---|---|---|---|---|
| 1 | The order arrives | Dealer | Email with a PDF | Sizes missing or unclear, in about one order in five |
| 2 | Order typed into the tracker | Office manager | Spreadsheet | Typos; one person at a time |
| 3 | Price worked out | Owner | A separate price sheet | Waits for the owner |
| 4 | Checked that it can be built | Owner | Memory | Waits for the owner; a few mistakes a month reach production |
| 5 | Sent to production | Office manager | Printed sheet | An old version gets printed |
| 6 | Invoice made | Bookkeeper | Accounting software | Amount typed again from the spreadsheet |
| 7 | Payment matched to the invoice | Bookkeeper | Bank export | Partial payments matched by hand |
Drawn as an As-Is map:
For a typical order, the time before it reaches production splits like this:
| Step | Work | Wait before it |
|---|---|---|
| 2. Order typed into the tracker | 15 minutes | Half a day, until the email is read |
| 3. Price worked out | 10 minutes | Up to two days, until the owner is free |
| 4. Checked that it can be built | 10 minutes | Usually none: the owner does it right after pricing |
That is 35 minutes of work and up to two and a half days of waiting, most of it for the owner. At 40 orders a week, steps 3 and 4 take about 13 hours of the owner's week.
The As-Is map shows three problems. The order is typed twice. Pricing and the build check wait for the owner, because those rules exist only in the owner's head. And a wrong order can reach production, because the only check is the owner's memory.
Drawing the To-Be map#
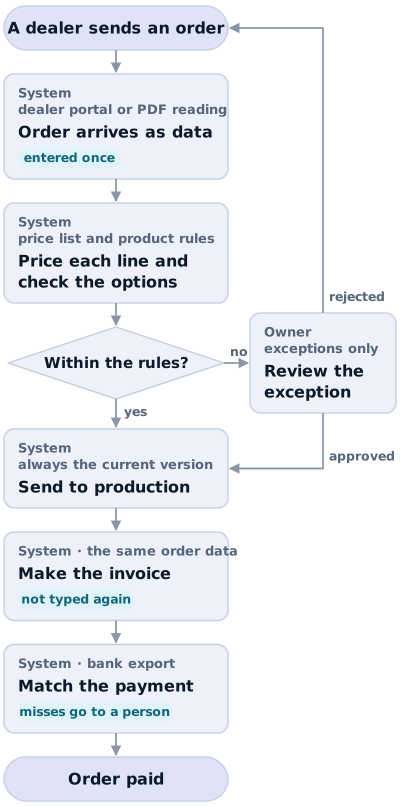
The To-Be map answers those problems with three changes:
- The order has to arrive as data. Dealers can enter orders in a portal where the sizes are required fields, or the system can read the emailed PDF into fields, with a person checking the ones it is unsure of. Software that only prices orders still leaves someone typing them in.
- The pricing and building rules have to be written down, then turned into software that prices each line and checks the options. The owner sees only the orders that break a rule.
- The invoice has to come from the same order data, so its amount is not typed again.
The rules come first. Until the owner writes down how a price is worked out and which options cannot be built together, the software has nothing to follow.
The To-Be map keeps the same start and end as the As-Is map, so the two can be compared step by step:
Before anything is built, walk a dozen recent orders through the To-Be map. An order that does not fit points to a rule nobody has written down yet.
How to map a process in five steps#
- Pick one process with a clear start and end, such as "order received" to "payment matched", and note how often it runs. Do not map the whole company at once.
- Walk through it with the people who do the work, not only with their managers. Watch them do it if you can.
- Draw it as it runs today, workarounds included. The To-Be map comes later.
- Mark every hand-off, every wait and every exception, with how long it takes and how often it happens.
- Check the map against real cases: take a dozen recent orders or invoices and follow each one through the map. Where a real case does not fit, the map is missing a step or an exception.
A process mapping template#
A spreadsheet is enough for a first map. The process map template has the columns from the example: step, who, tool, work time, wait before it, what goes wrong and how often. It opens in Excel, Google Sheets or Numbers. Its rows hold the example order, so you can see how it is filled in before replacing them with your own. Once it holds your process, the longest waits and the most frequent problems show where to start.
Business process mapping tools#
The tool matters less than the walk-through. Sticky notes on a wall or a whiteboard work well for the first version, because people correct them on the spot. For a diagram to keep and share, process mapping software such as Lucidchart, Miro, Microsoft Visio or the free draw.io has all the shapes above.
From the map to automation#
Go through the To-Be map step by step and decide what happens to each one:
- Monotonous steps with a clear rule, such as pricing from a price list, go to ordinary software.
- Small, routine decisions, where something has to be understood, weighed and chosen, such as reading an emailed PDF into fields, can go to AI.
- Complex decisions, such as a price exception, stay with a person, who gets the AI's comments.
- Steps that exist only because two tools do not talk to each other are removed.
Not every change needs new software. A required field on the order form, or a connection the accounting software already offers, can fix a step before anything is built.
How to tell which steps need AI is covered in AI for small business.
Where to start#
Pick the process where people complain most about retyping or waiting, and map it with the template. If you want a second pair of eyes, start with a free 30-minute call about that one process. We look at how it actually runs, and you leave with a rough map of it, whether or not we work together.
Sources
-
Object Management Group, "Business Process Model and Notation (BPMN)". https://www.omg.org/spec/BPMN ↩